
How Do You Centralize Multi-Source BI? A Multi-Source BI Centralization Plan

TL;DR
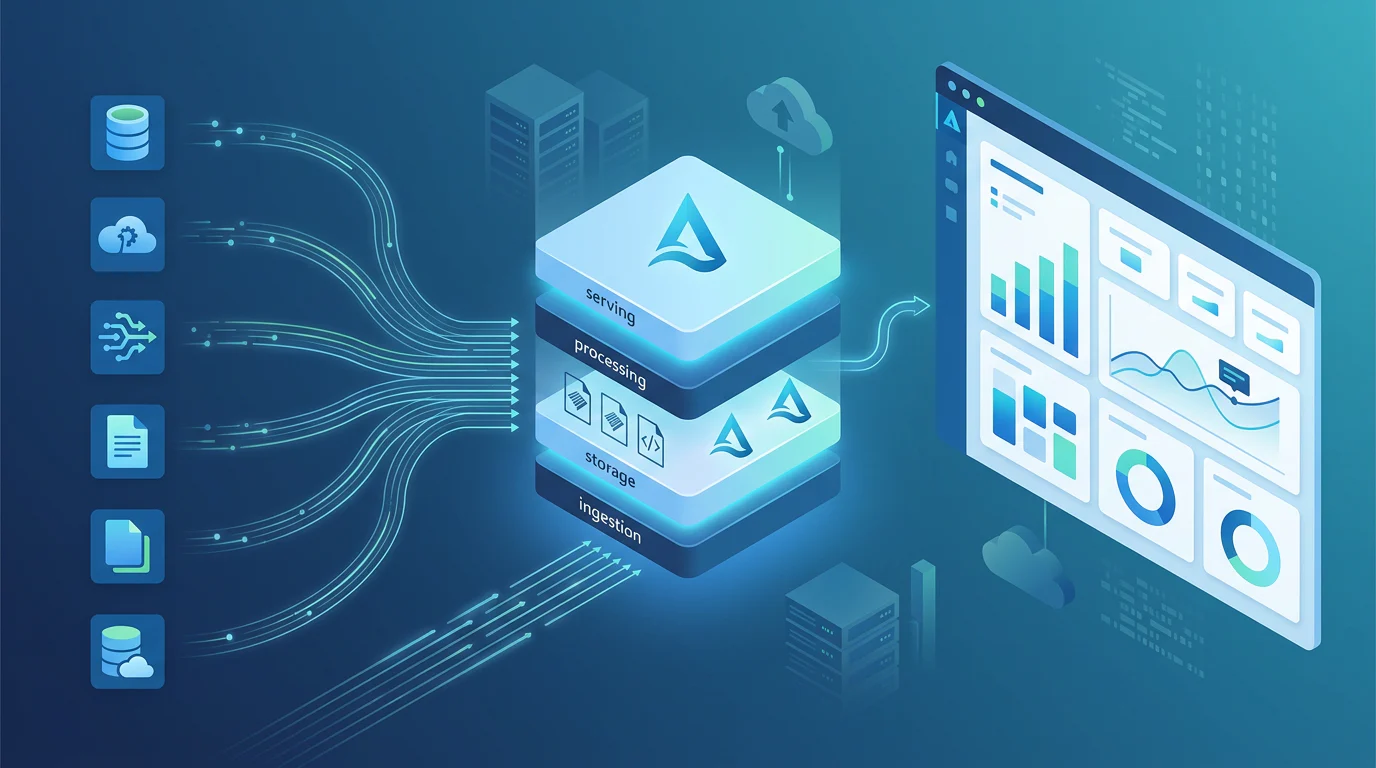
We centralize multi-source BI by moving joins and business rules from dashboards into reusable Bronze, Silver, Gold, and semantic layers. This blueprint helps Azure data engineering teams choose ingestion patterns, model shared entities, protect Power BI speed, and consolidate tools gradually without replacing operational systems.
How Do You Centralize Multi-Source BI? A Multi-Source BI Centralization Plan
In our work with Azure data engineering teams, dashboard performance becomes fragile when the report model turns into an integration layer. Power BI guidance treats five seconds or less as a good DirectQuery visual experience, which is a useful bar when one report coordinates several systems.
Multi-source BI centralization works when we move joins and business rules out of dashboards into governed, reusable layers. We land source-aligned data first, standardize shared entities next, and publish optimized facts, dimensions, and semantic models last. That keeps source traceability while delivering consistent metrics, security rules, and dependable query paths without replacing operational systems.
In this article, we map the architecture, source-ingestion choices, canonical model, performance controls, and gradual consolidation sequence that make that change practical.
What Architecture Delivers Multi-Source BI Centralization Without Slow Dashboards?
We start by separating two decisions that are often blurred together: where data should be made available and where dashboards should query it. A lakehouse is usually the integration backbone for mixed operational, file, API, and event sources. A warehouse can be the SQL-serving layer for mature Gold products. Virtualized access is valuable during transition, but it should not become the permanent home of repeated dashboard joins.
| Decision Criterion | Lakehouse | Warehouse | Virtualized Or Federated Access |
|---|---|---|---|
| Source Volatility | Best for mixed batch, CDC, and streaming inputs | Best after data is stable and curated | Best when data must remain at its source |
| Dashboard Latency | Strong with prepared Delta tables and semantic models | Strong for SQL-first, concurrent reporting | Depends on source latency and cross-source execution |
| Transformation Complexity | Best for reusable multi-source standardization | Best for relational serving transformations | Poor fit for repeated multi-source joins |
| BI Concurrency | Use Gold products, aggregations, and caching | Use workload-managed SQL serving | Limit to low-volume or transitional analysis |
| Governance | Supports lineage from source through curated products | Supports relational controls and governed SQL | Retains source permissions and definitions |
| Duplication | One governed analytical copy where needed | Can share the same Delta foundation | Avoids initial copies, not the need for curated data |
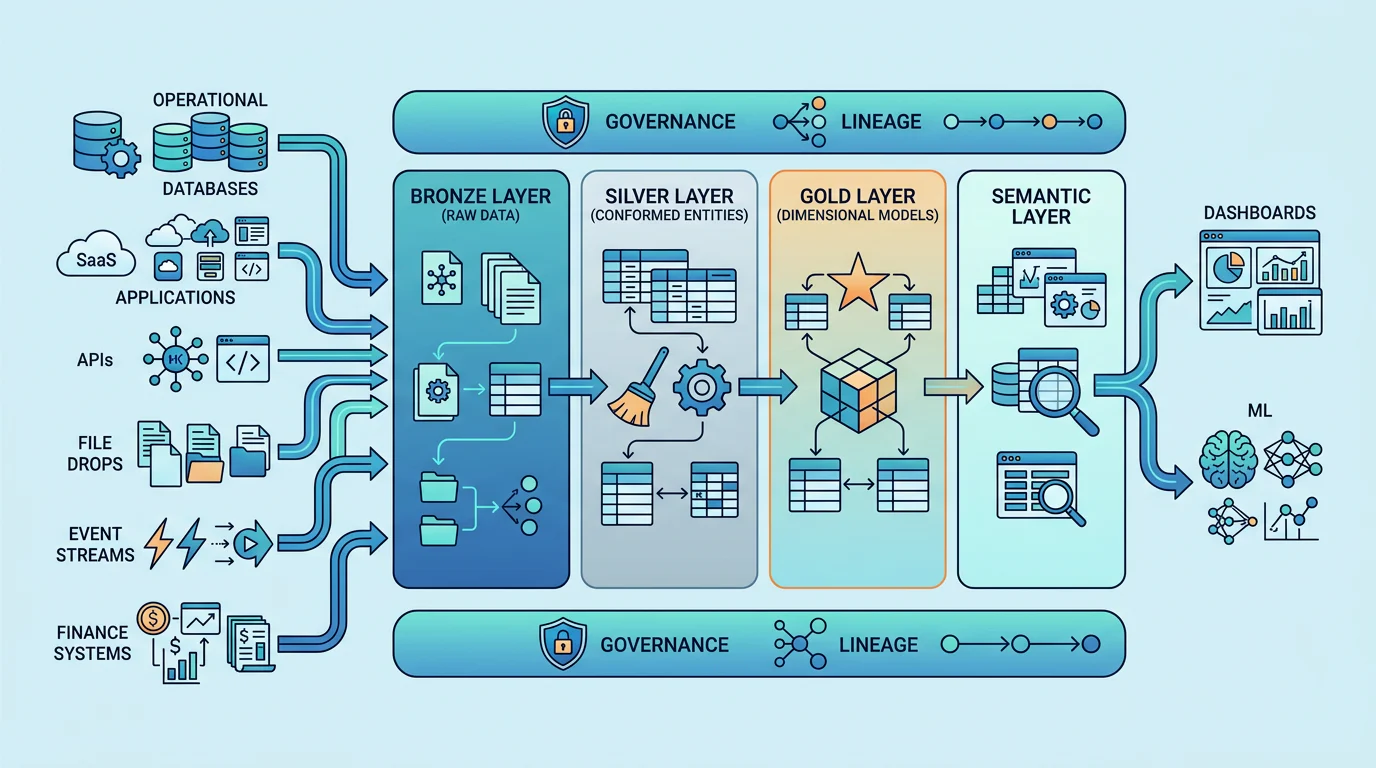
For a lakehouse architecture for BI dashboards, Bronze holds source-aligned evidence, Silver resolves shared entities, Gold serves report-ready facts and dimensions, and the semantic model provides a stable business interface. Current data-store guidance confirms that lakehouses and warehouses can share a Delta and Parquet foundation while serving different workload needs.
The failure pattern is simpler: every dashboard imports, transforms, and joins its own version of the same data. That creates duplicate metrics, refresh failures, and inconsistent filters. Instead, we use dashboards as consumers of prepared products, then use a unified platform to keep engineering, BI, and ML work connected to shared governed data.
How Do Bronze, Silver, Gold, and Semantic Layers Replace Dashboard Joins?
The medallion architecture becomes useful for BI only when each layer has a distinct responsibility. We do not move every source table into a new location and call the job complete. We decide which layer owns traceability, conformance, dimensional modeling, and the business definitions that reports rely on.
What Belongs in Bronze?
Bronze preserves what each source delivered, including native keys, arrival timestamps, load identifiers, and failed-record evidence. We keep transformations minimal so engineers can replay a load, reconcile a disputed value, and prove which operational record informed a dashboard result. Open-format data can remain in place through shortcuts when that avoids an unnecessary first copy.
What Becomes Reusable in Silver?
Silver is where we standardize timestamps, currencies, status values, identity rules, and shared identifiers. This is also where we materialize the joins that recur across reports, such as customer-to-account or transaction-to-product relationships. A single tested Silver transformation is far easier to govern than six visually similar joins scattered through report files.
What Should Gold and the Semantic Layer Publish?
Gold contains star-schema facts, conformed dimensions, and intentional aggregates. The semantic model then owns report-facing measures, hierarchies, relationships, metric labels, and row-level access rules. Official architecture guidance recommends this separation so curated models can serve analytics while identity, governance, and lineage remain cross-cutting controls.
| Layer | Primary Responsibility | Where Joins And Rules Belong | Main Consumers |
|---|---|---|---|
| Bronze | Raw source-aligned data and audit metadata | Ingestion validation only | Engineers and audit processes |
| Silver | Cleansed, standardized, canonical entities | Identity resolution and reusable transformations | Engineers, analysts, ML workloads |
| Gold | Facts, dimensions, aggregates, certified products | Dimensional relationships and serving rules | BI and SQL consumers |
| Semantic Layer | Measures, definitions, hierarchies, row security | Report-facing metric contract | Power BI reports and self-service users |
We use this model to stop report authors from rebuilding upstream logic. A governed lakehouse gives every layer an owner and gives dashboards one approved route to trusted metrics.
How Do You Build a Canonical Model for Heterogeneous Sources?
A canonical model is not an attempt to erase source systems. It is the analytical contract that lets different systems describe the same customer, account, product, or transaction without forcing every report to understand every native schema. We build it around business entities that recur across decisions, then retain source identifiers and lineage so the model stays explainable.
| Canonical Entity | Required Shared Identifier | Silver Mapping Rule | Gold Use |
|---|---|---|---|
| Customer | Canonical key plus source-system IDs | Match CRM, billing, and support records while retaining match status | dim_customer |
| Product | Canonical key plus source SKU | Standardize product family, units, and lifecycle status | dim_product |
| Account | Canonical key plus operating-account IDs | Resolve parent-child structures and ownership changes | dim_account |
| Transaction | Immutable transaction ID plus source ID | Preserve source grain, event time, amount, and currency | fact_transaction |
For example, a customer may have one CRM ID, a different billing account number, and multiple support identifiers. We map those records to one canonical key in Silver, preserve every source key for reconciliation, and let Gold facts join through the canonical key alone. That approach aligns with conformed-key guidance for cross-system identifiers and standard dimensions.
We only add attributes to the canonical contract when more than one downstream use case needs them. Source-specific fields can remain source-aligned until their business meaning is clear. Teams building this capability can use our centralization guide to connect canonical modeling decisions to a practical lakehouse delivery path.
Which Ingestion Method Fits Each of Six Heterogeneous Sources?
We choose ingestion by source behavior, freshness needs, and the value of making an analytical copy. Copying everything on day one adds cost and migration risk. Querying everything in place leaves dashboard performance at the mercy of operational systems. The better approach applies batch, CDC, streaming, and virtualization deliberately.
| Source Type | Default Bronze Choice | Why It Fits | When To Escalate |
|---|---|---|---|
| Transactional SQL Database | CDC or mirroring | Captures incremental changes for analytical use | Use pipelines for custom orchestration |
| SaaS Application API | Scheduled incremental batch | Matches API limits and business cadence | Use CDC where natively supported |
| Open Delta Or Parquet Data | Shortcut or virtualized access | Avoids a needless first copy | Materialize when joins recur |
| CSV Or Spreadsheet Drops | Batch pipeline | Creates an auditable, repeatable load | Add event triggers for frequent arrivals |
| Event Broker Or Telemetry | Eventstream | Handles append-oriented, real-time events | Publish aggregates for dashboard queries |
| Legacy Or Partner Database | Mirroring or incremental copy | Keeps the operational system intact | Retire only after validated migration |
Fabric supports pipelines, copy jobs, mirroring, eventstreams, and shortcuts, so we can choose the smallest disruptive change for each source. Its ingestion options also distinguish virtual access from the complex transformations that still require pipelines or transformations.
Once the landing choices are clear, we consolidate in six controlled steps:
- Inventory The Evidence: Record sources, report joins, duplicate measures, refresh failures, owners, and freshness expectations.
- Select One Domain: Choose a dashboard with repeated cross-source logic and clear business ownership.
- Land Source Data: Bring only the relevant source tables into Bronze through the least disruptive pattern.
- Build Silver Contracts: Test identity mapping, quality rules, and reconciliations against the existing report.
- Publish Gold And Semantic Models: Replace dashboard joins with certified facts, dimensions, and measures.
- Expand By Domain: Retire duplicate report logic only after adoption, security testing, and metric validation.
This sequence preserves working operational systems while reducing the work that report authors repeat. For teams balancing scheduled loads and real-time requirements, our batch and streaming guide helps frame one coordinated delivery approach.
How Do You Keep Centralized Power BI Dashboards Fast and Governed?
Centralizing data does not automatically produce faster dashboards. We still need a serving path designed for actual filters, concurrency, and freshness expectations. The aim is to make the common query cheap, predictable, and protected, then reserve detailed or remote access for the cases that genuinely require it.
Design the Serving Path
We point reports to Gold products and certified semantic models, not directly to Bronze or operational sources. Direct Lake can load requested Delta columns into memory on demand, while DirectQuery can preserve freshness where needed. Understanding Direct Lake behavior helps us keep semantic models narrow and avoid accidental fallback paths.
Build for Filters and File Layout
We partition only where common filters or retention policies can benefit, avoid high-cardinality partition sprawl, and compact small files before they multiply query overhead. Fabric documents a default 1 GB target for OPTIMIZE, but we validate it against real workloads rather than treating it as universal file-size guidance. Our BI performance guide helps teams translate these storage choices into report-serving decisions.
Materialize Repeated Work
We materialize common joins and dashboard aggregates in Gold when the same computation appears across many visuals. Semantic-model measures should define business logic once, while aggregation tables and caching serve frequently requested summaries. This protects source systems and prevents each report from inventing a new version of gross margin, active customer, or inventory availability.
Isolate Workloads and Security
We separate ingestion, transformation, interactive BI reads, ad hoc analysis, and ML execution so one workload does not starve another. Fabric Warehouse defaults to isolated SELECT and non-SELECT pools that split available compute evenly, according to its workload management documentation. We pair that isolation with semantic-model row security, workspace controls, and explicit ownership of every metric. A consolidation plan keeps those safeguards intact as more domains move onto the shared foundation.
How Can Vision Board Help with Multi-Source BI Centralization?
At Vision Board, we help Azure data engineering teams turn architecture decisions into working habits. We teach teams how to trace a dashboard metric back through a semantic model, Gold product, canonical entity, and source contract, then test whether the path is fast, secure, and maintainable. Our learning approach focuses on the practical work that reduces repeated joins: selecting ingestion patterns, shaping Delta tables, modeling facts and dimensions, and protecting BI read workloads while pipelines keep moving. We also help teams sequence change so a useful first domain goes live before a broad platform rewrite becomes necessary. If your dashboards, engineering jobs, and ML work currently live in separate lanes, we can help your team build shared vocabulary and repeatable delivery practices around a governed lakehouse that holds up under real delivery pressure. Explore our courses and learning paths with Vision Board.
FAQs on Multi-source BI Centralization
Can We Centralize BI Without Copying Every Source?
Yes. Virtualize eligible open-format data during transition, then materialize recurring joins, standardized entities, and dashboard aggregates where predictable performance, freshness, and governance matter most in production.
Should Power BI Join Source Systems Directly?
Only for short-lived exploration. For production reporting, centralize shared entities and business rules upstream, then let reports query certified semantic models built on curated data products.
When Should We Add a Warehouse?
Add a warehouse when curated SQL reporting needs relational development and workload controls. Keep the lakehouse for varied formats, transformations, shared storage, and ML access.