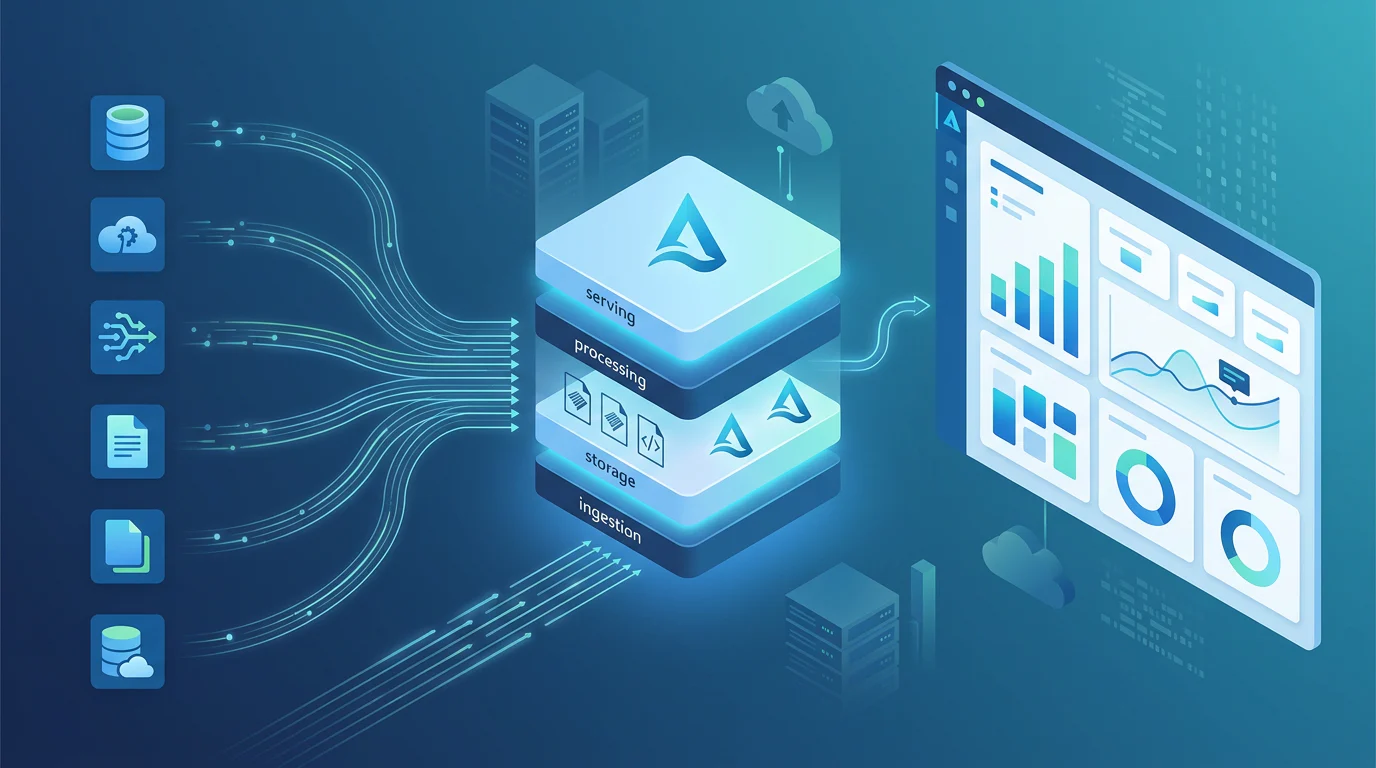
How Do You Centralize Analytics Data? A Lakehouse Architecture for Multiple Data Sources

TL;DR
At Vision Board, we centralize analytics by landing each source once, moving conformance and business logic upstream, and serving BI through governed semantic models. This guide shows Azure data engineers how to choose lakehouse, warehouse, or federation patterns, model shared entities, protect query speed, and migrate dashboards in stages without a disruptive replacement.
How Do You Centralize Analytics Data? A Lakehouse Architecture for Multiple Data Sources
Dashboard joins become a platform problem when every report must reconcile a different version of customer, product, or transaction data. In composite BI models, cross-source relationships can fail when cardinality exceeds 1 million values.
Centralize analytics with a lakehouse architecture for multiple data sources: land each source once, preserve a replayable raw record, standardize shared entities in a governed curated layer, then serve dimensions, facts, and certified metrics through a semantic model. Keep federation for sources that must remain in place or need near-source access.
We will show where joins belong, how the layers divide responsibility, and how to consolidate tools without forcing a disruptive replacement. The focus is Azure data engineering teams supporting BI, data engineering, and ML from the same governed foundation.
Why Do Dashboard Joins Multiply Across Sources?
A dashboard should answer a business question, not become the place where an organization integrates its operational systems. When report authors connect directly to several databases, files, and applications, each report starts carrying its own customer matching rules, date logic, product mappings, and refresh assumptions.
That produces familiar symptoms: measures with the same name return different totals, a source outage breaks several reports, engineers maintain parallel extracts, and analysts solve relationship problems with many-to-many workarounds. A visual can send multiple source queries, so query speed increasingly depends on the least responsive source and the complexity of filter propagation.
The fix is architectural, not cosmetic. Move reusable joins and business rules into curated tables, give those tables a declared grain, and expose them through a certified semantic model. Reports can then focus on slicing trusted facts rather than reassembling the enterprise on every refresh.
This same pattern makes an unified analytics platform practical: engineering owns reusable data products, BI owns governed measures, and ML can consume validated data without creating a separate storage estate.
When Is a Lakehouse Architecture for Multiple Data Sources the Right Choice?
A lakehouse is strongest when the same data must support BI, engineering, and ML, especially when the estate mixes relational, semi-structured, streaming, and file-based data. It gives teams a shared place to land and transform data while keeping storage open to multiple workloads.
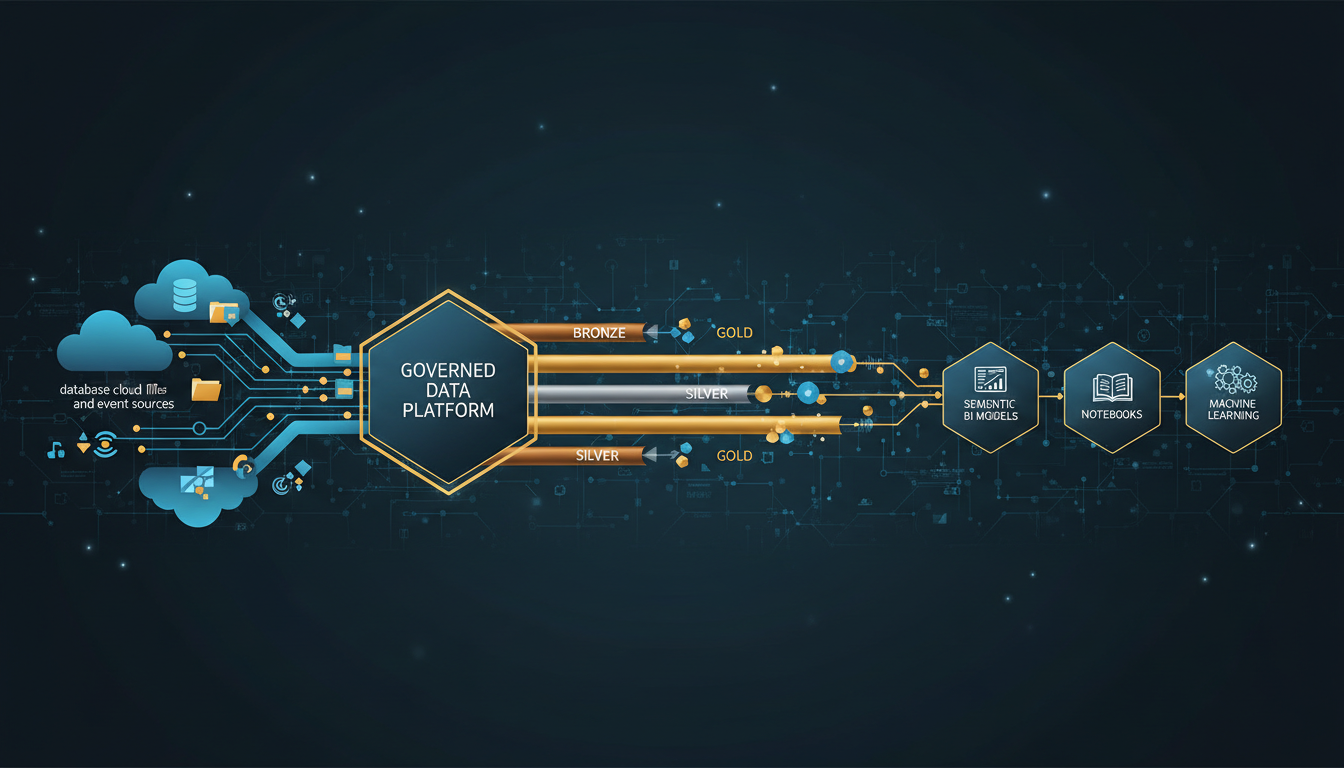
A warehouse remains useful for SQL-first, relational serving. Federation remains useful when a source cannot move yet, but it should be a temporary access pattern rather than the permanent home of shared cross-source logic. Current platform guidance distinguishes lakehouses for diverse engineering workloads, warehouses for large-scale relational analytics, and eventhouses for real-time event processing.
| Criterion | Lakehouse | Warehouse | Federation |
|---|---|---|---|
| Latency Pattern | Predictable after curated materialization | Predictable for SQL-first serving | Depends on source, network, and concurrency |
| Best Workload | BI, engineering, ML, mixed data types | Relational BI and SQL analytics | Discovery, transition, residency constraints |
| Governance | Shared storage, lineage, and semantic layer | Strong relational controls | Governance crosses source boundaries |
| Duplication | Land once and reuse shared tables | Curated copies are typical | No copy for virtualized data |
| Migration Fit | Move source-by-source | Best for stable relational domains | Keep only for bounded exceptions |
We recommend starting with the data products that create the most repeated joins. For broader design choices, our Azure lakehouse engineering guide helps teams assess workload fit before committing to a migration path.
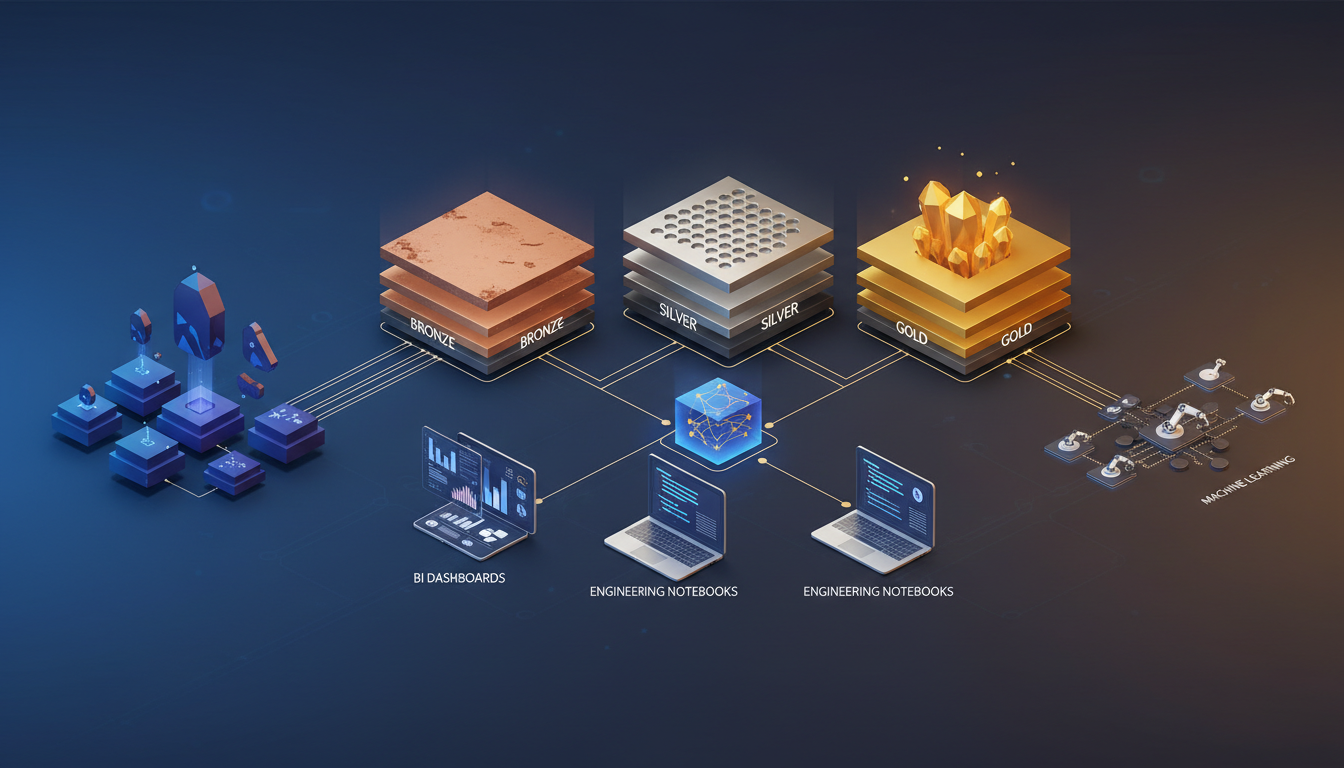
How Should Bronze, Silver, Gold, and Semantic Models Divide Work?
Layering is useful only when each layer has a distinct responsibility. Without those boundaries, raw extracts become reporting tables, dashboards recreate transformations, and every team owns a different version of the same entity.
What Belongs in Bronze?
Bronze is the source-faithful landing zone. Store raw records with source metadata, ingestion timestamps, batch identifiers, and enough history to replay a failed transformation. Choose batch for scheduled loads and backfills, CDC for incremental operational changes, and streaming for low-latency events.
The important rule is simple: do not make Bronze the business-facing answer layer. Raw data is valuable for traceability and replay, but it has not yet earned the trust required for shared reporting.
What Belongs in Silver?
Silver is where data becomes reusable. Validate schemas, quarantine invalid rows, deduplicate records, normalize dates and currencies, and resolve source identifiers into canonical entities. This is where crm_account_id, erp_customer_number, and a support-system email address can become one durable customer identity.
Use data-quality gates deliberately. Current quality rule types cover freshness, uniqueness, format, data type, duplicate rows, blank values, lookup checks, and custom rules. Those checks should produce visible operational outcomes, not merely pass or fail in a pipeline log.
What Belongs in Gold and the Semantic Layer?
Gold publishes business-ready facts, dimensions, aggregates, and feature-ready tables. The semantic layer then adds certified measures, understandable field names, model relationships, and security rules so report authors do not need to rediscover the data model.
| Layer | Primary Responsibility | Main Consumers | Exit Gate |
|---|---|---|---|
| Bronze | Raw landing, audit, replay | Engineers and operations | Complete ingest with source metadata |
| Silver | Validation, conformance, enrichment | Engineers, analysts, ML | Canonical keys and quality checks pass |
| Gold | Facts, dimensions, aggregates | BI, SQL users, ML | Grain and reconciliation are approved |
| Semantic Model | Metrics, relationships, security | Dashboards and self-service BI | Measures are certified and tested |
This structure is easier to govern when teams share a common vocabulary and skill set. Our lakehouse curriculum audit explains the practical capabilities an Azure data engineering program should cover.
How Do You Model Shared Customers, Products, and Transactions?
Centralization fails if data lands in one location but keeps the source system’s incompatible definitions. The goal is not one giant table. It is a small set of canonical entities and serving models that make recurring joins unnecessary.
Start in Silver with durable business identifiers and crosswalks. Then publish Gold tables at a clear grain, such as one transaction line, one daily account balance, or one customer interaction. A star schema approach keeps dimensions focused on filtering and grouping while facts hold events and measures.
| Source Entity | Silver Canonical Entity | Gold Serving Pattern | Upstream Rule |
|---|---|---|---|
| CRM Account | canonical_customer | DimCustomer | Match source account IDs to a durable customer ID |
| ERP Item | canonical_product | DimProduct | Standardize SKU, category, and unit |
| Orders And Invoices | canonical_transaction | FactTransaction | Define one transaction grain and amount logic |
| Customer Or Product Changes | Versioned canonical entity | Type 2 dimension where history matters | Join facts to the valid version on the event date |
For slowly changing attributes, use Type 1 when only the latest value matters and Type 2 when history affects reporting. A Type 2 dimension needs a surrogate key, effective dates, and a current-state indicator. That lets historical facts retain the customer region, product price, or account classification that applied when the event occurred.
Avoid hiding these decisions in report calculations. Put the canonical model in the data layer, document its ownership, and let every downstream dashboard reuse it. Our Azure data engineering roadmap helps teams sequence the skills required to implement that model.
How Do You Transition to a Faster Shared Analytics Platform?
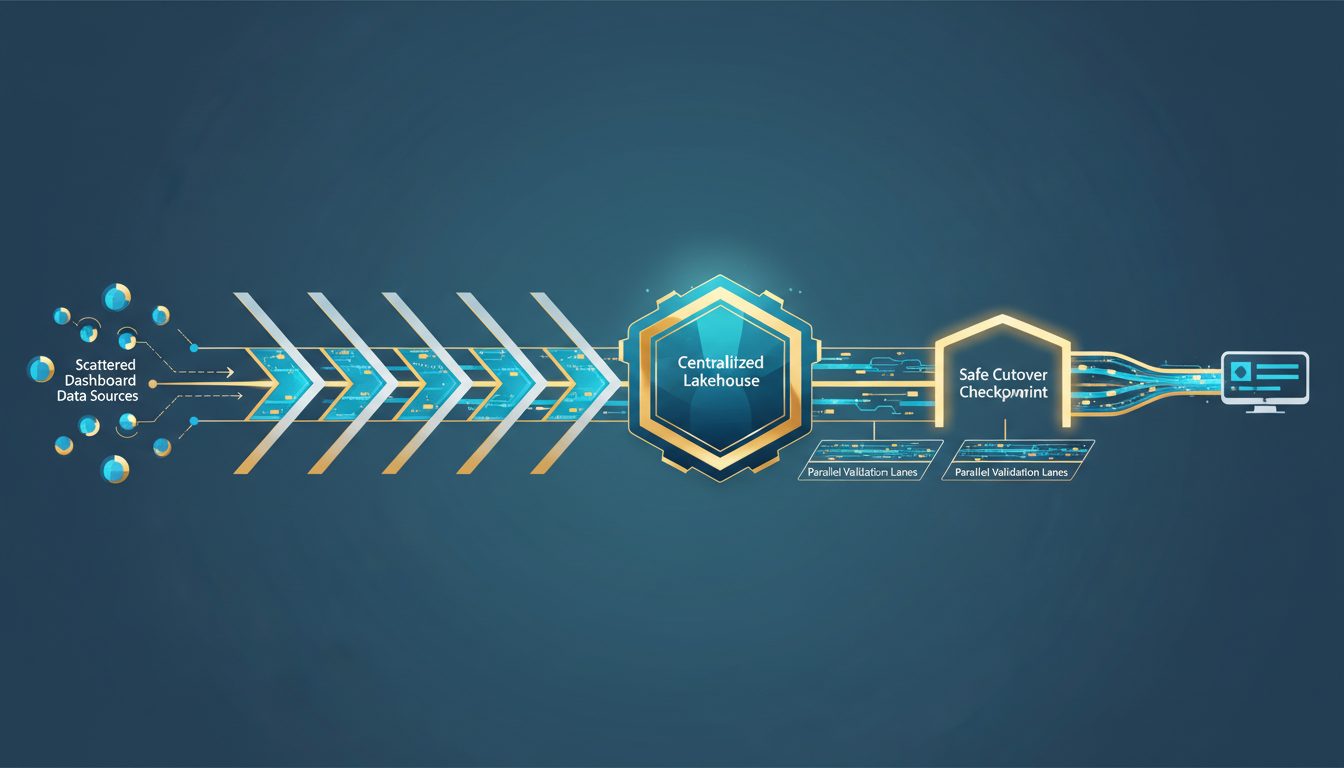
A successful consolidation preserves working dashboards while moving their dependencies upstream. The transition should prove correctness and performance one domain at a time, not demand that every team changes tools on the same date.
Select Ingestion by Freshness Need
Use batch for historical loads and predictable refresh windows. Use CDC where operational updates must arrive incrementally, with watermarks and idempotent processing. Use streaming for events that need near-real-time analysis, while keeping raw events available for replay.
Materialize Repeated Work
Materialize expensive cross-source joins, common aggregations, and serving views in Gold. Partition large facts by stable time filters, optimize file layout, and avoid letting small files accumulate. Direct Lake can fall back when conditions are not met, and the documented 10,000-file guardrail is a useful signal to monitor file maintenance before dashboard performance suffers.
Teams replacing legacy package workloads can apply the same discipline to incremental loading, exception handling, and deployment sequencing. Our SSIS migration guide shows how to carry those operational concerns into Azure migration work.
Isolate Serving Workloads
Protect interactive BI from heavy transformation and ML workloads. Schedule large backfills away from peak report usage, separate engineering capacity from serving capacity where possible, and test certified models with real concurrency instead of only notebook benchmarks.
Cut over in Five Stages
| Stage | Deliverable | Dashboard Impact | Exit Criterion |
|---|---|---|---|
| 1. Baseline | Join, metric, and refresh inventory | None | Priority domain is approved |
| 2. Land | Bronze data with audit and replay | None | Completeness checks pass |
| 3. Conform | Silver canonical entities | Legacy dashboards remain | Key and quality checks pass |
| 4. Serve | Gold tables and semantic model | Parallel validation | Metrics and performance match |
| 5. Cut Over | Dashboard redirects and retired copies | Incremental | Owner acceptance and monitoring complete |
Use shortcuts or mirrored access only where they reduce disruption. Their purpose is to keep data available during transition, not to preserve duplicated transformation logic forever. Our modern Azure data engineering course audit explains the practical platform capabilities teams should validate before a wider rollout.
Build the Migration Skills with Vision Board
At Vision Board, we teach the architecture decisions that make this migration durable: how to map sources, design conformed entities, build incremental pipelines, model Power BI for reliable performance, and validate a cutover without disrupting business reporting. Our learning is built for Azure data engineers who need to explain tradeoffs clearly, not merely assemble a demo. We focus on the practical work behind dependable delivery: naming data owners, defining quality gates, choosing ingestion patterns, building semantic models, isolating workloads, and communicating dashboard changes with the people who rely on them. Whether you are untangling dashboard joins, moving legacy packages, or preparing a shared foundation for engineering and ML, our courses help turn design principles into repeatable implementation practice. Along the way, we emphasize testing, lineage, stewardship, and measured cutovers so the operating model remains clear after deployment. Begin your next build with Vision Board
FAQs on Lakehouse Architecture for Multiple Data Sources
How Do You Centralize BI Dashboards Without Breaking Existing Reports?
Centralize gradually: inventory report joins, land the priority source in Bronze, publish a compatible semantic model, validate results in parallel, then redirect each dashboard safely.
When Should You Use Federation Instead of Moving Data?
Use federation when a source must remain in place because of residency, ownership, or operational needs. Move recurring cross-source joins and reusable metrics upstream instead.
How Do You Reduce Joins Across BI Sources?
Reduce joins by standardizing customer, product, and transaction keys in Silver, then publishing Gold facts and dimensions at a declared grain for the semantic model.
Can One Lakehouse Support BI, Engineering, and ML?
A shared lakehouse can support BI, engineering, and ML when teams reuse governed Delta data, isolate compute workloads, materialize serving tables, and manage freshness deliberately.