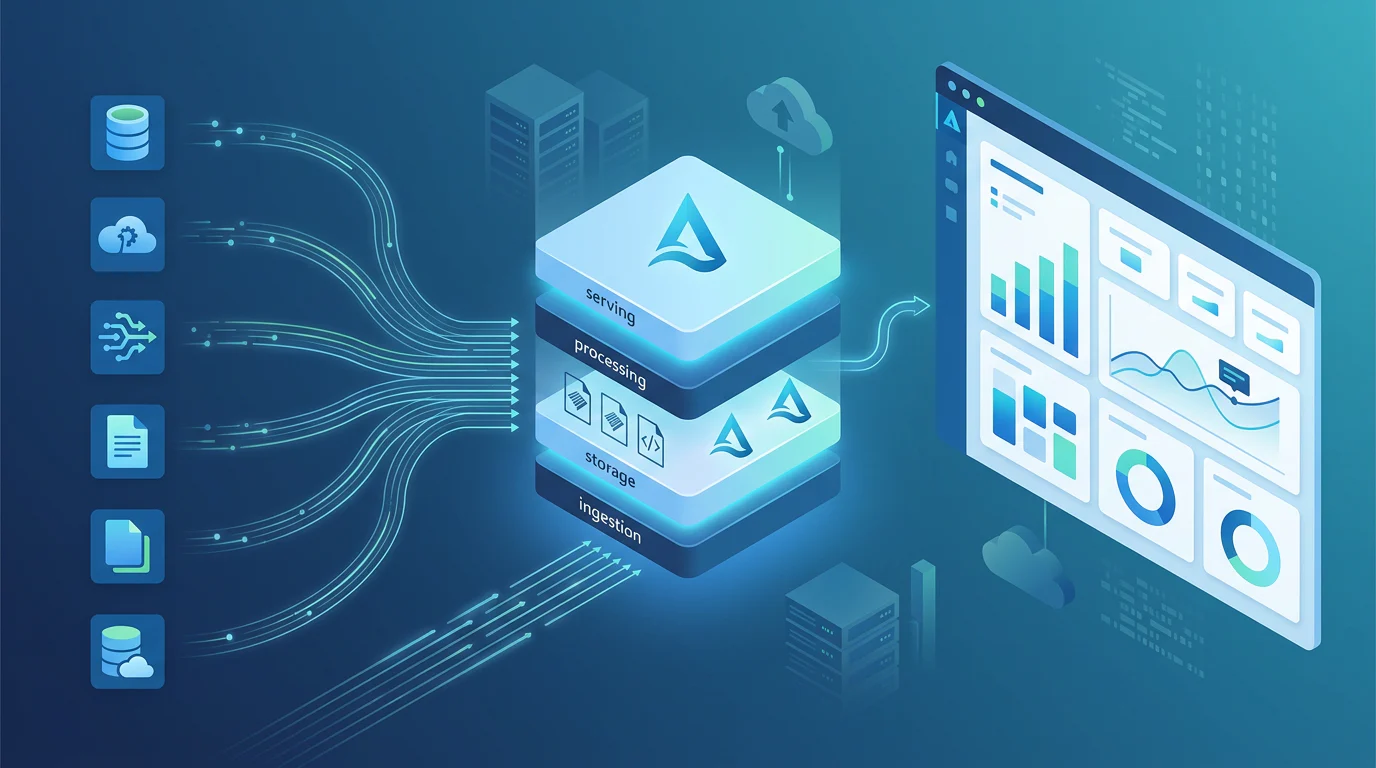
How Does a Lakehouse Speed up BI? A Lakehouse Architecture for BI Performance

TL;DR
At Vision Board, we show Azure data engineers how a lakehouse speeds up BI by materializing reusable Bronze, Silver, and Gold data products instead of repeatedly joining operational sources. We also compare centralization patterns, select serving models, isolate workloads, govern shared data, and migrate dashboards with measured performance evidence.
How Does a Lakehouse Speed up BI? A Lakehouse Architecture for BI Performance
Multi-source dashboards slow down when every visual repeats joins, transformations, and metric logic against systems that were built to run the business, not serve interactive analytics. Fabric documents a 2,048 session limit per workspace, which makes workload design a capacity concern, not just a modeling preference.
A lakehouse architecture for BI performance speeds up multi-source dashboards by moving recurring joins and transformations from visual queries into governed Bronze, Silver, and Gold data products. Shared Delta storage, isolated compute, a semantic layer, and caching let BI and machine learning reuse trusted data while protecting operational systems.
We map the architecture, the serving decisions, and the migration sequence for Azure data teams consolidating six or more sources. This page was reviewed on August 20, 2026.
Why Do Dashboards Slow Down When They Join Six Operational Sources?
A dashboard can look simple while its backend query plan is anything but. A sales visual may join orders, customer records, product attributes, finance targets, support data, and a SaaS export. When each report performs that work independently, latency compounds, metrics diverge, and operational systems receive analytics traffic they were never sized to absorb.
The first fix is not to hide the delay with a prettier report. We recommend tracing each visual to its sources, transformations, credential path, and KPI definition. That exposes duplicate logic and clarifies which joins belong upstream. Teams planning pipeline modernization can use this inventory as the first migration backlog.
Caching helps with popular dashboard tiles, but it cannot correct inconsistent data products or fragile cross-source joins. Power BI notes that its dashboard cache does not serve live report tiles, and DirectQuery dashboard-cache refreshes default to hourly. Fast, trustworthy dashboards need a serving model that is designed before users open the report.
What Does a Lakehouse Architecture for BI Performance Look Like?
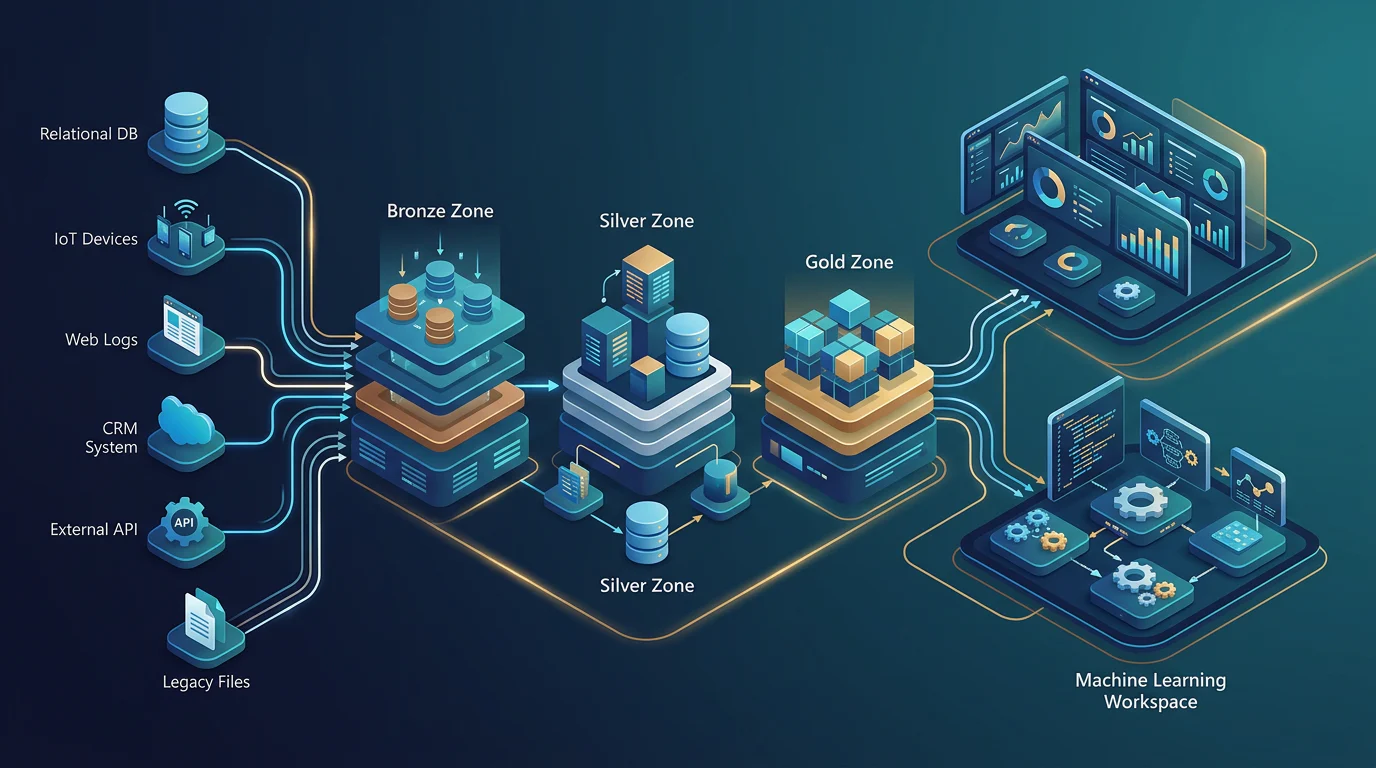
We use a lakehouse to make data movement deliberate. Sources land once, reusable transformations happen upstream, and dashboards ask prepared models for answers. That changes the question from “Can this visual join six systems?” to “Which governed product should this visual consume?”
Architecture Diagram: Six-Source BI Flow.
Operational Databases | SaaS Apps | APIs | Files | Events | Finance Systems
                                  |
                                  v
                    Ingestion Compute And Source Contracts
                                  |
                                  v
                  Bronze: Raw, Source-Aligned Delta Tables
                                  |
                                  v
          Silver: Validated, Conformed Entities And Reusable Joins
                                  |
                                  v
       Gold: Star Models, Aggregates, Metrics, Certified Data Products
                                  |
                                  v
 Direct Lake | Semantic Layer | Materialized Views | Dashboard Cache
                                  |
                     BI Dashboards | Ad Hoc SQL | ML

Cross-Cutting Controls: Catalog | Lineage | Ownership | Access Policies
Isolated Compute: Ingestion | Transformation | BI Read | Ad Hoc | ML
What Belongs in Bronze?
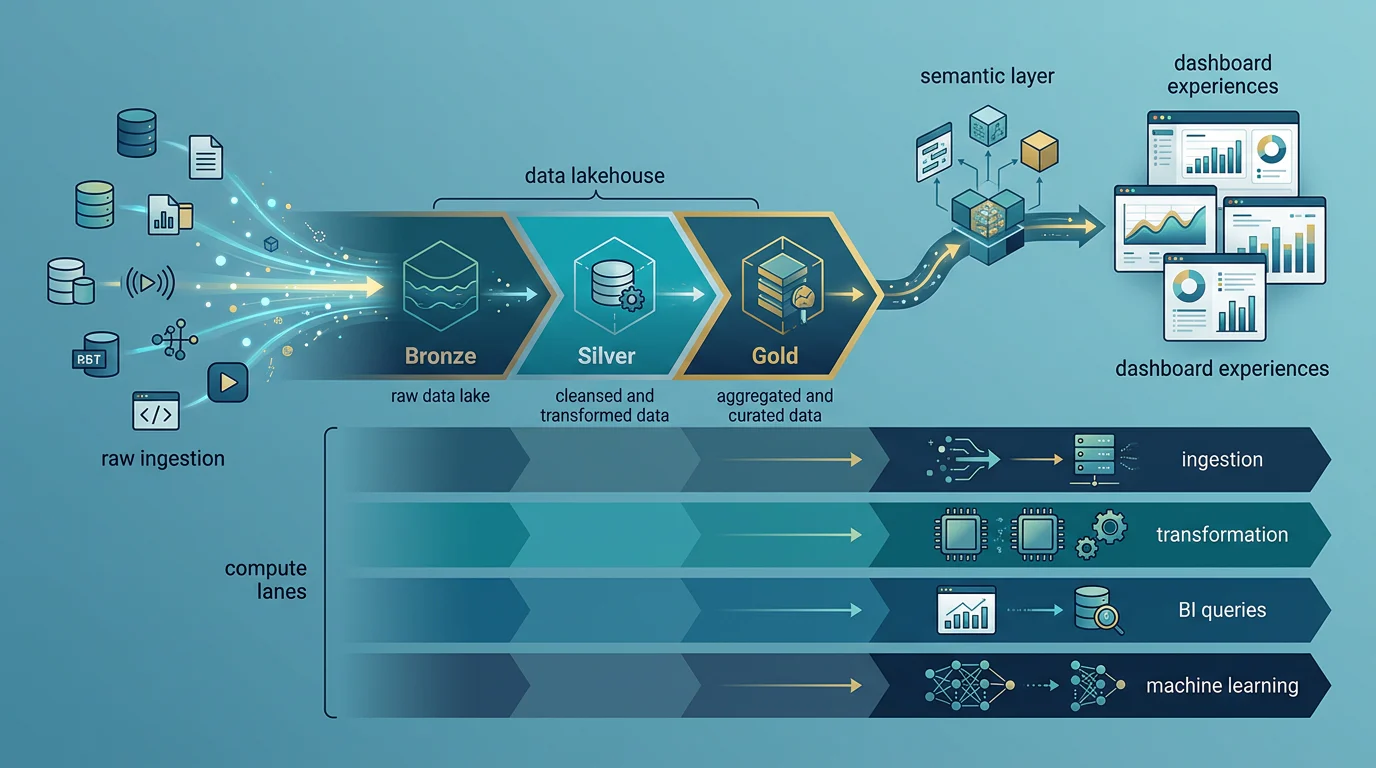
Bronze preserves source-aligned records, arrival times, ingestion identifiers, and failed-record evidence. We keep it close enough to the source to replay pipelines and investigate disputes, rather than shaping it around one dashboard’s temporary need.
What Becomes Reusable in Silver?
Silver standardizes the data that repeatedly causes dashboard pain: customer identities, product keys, currencies, calendar logic, status values, and quality rules. The commonly used medallion layers assign raw ingestion to Bronze, cleaning and validation to Silver, and dimensional modeling and aggregation to Gold.
What Should Gold Serve?
Gold contains business-ready facts, dimensions, aggregates, and metric definitions. It is where we materialize the repeated joins that previously ran at dashboard time, then publish a stable contract for BI consumers. Our guide to centralizing analytics data can support teams designing their first Gold products.
How Should Compute Be Isolated?
Ingestion, transformation, BI reads, ad hoc analysis, and machine learning should not compete blindly for the same resources. In Fabric Warehouse, documented workload pools split SELECT and non-SELECT work into isolated 50/50 pools, helping protect read workloads from ingestion pressure.
Which Centralization Pattern Fits Your Azure Data Team?
A lakehouse is not the only centralization pattern, but it is often the strongest fit when BI, engineering, and ML need common governed data. We recommend choosing based on workload shape, ownership maturity, and the disruption your reporting estate can tolerate, rather than treating every platform pattern as interchangeable.
| Criterion | Lakehouse | Warehouse-First ELT | Data Federation | Data Mesh |
|---|---|---|---|---|
| Query Performance | Predictable when Gold products are materialized | Strong for curated structured BI | Variable, depends on remote sources | Depends on each data product |
| Maintenance | Medium, with shared layers and table maintenance | Medium, with SQL-first pipelines | Low initial effort, higher troubleshooting risk | High coordination requirement |
| Duplication | Low with shared storage and shortcuts | Often higher across BI and ML copies | Low physical duplication | Varies by domain implementation |
| Governance | Central catalog, lineage, contracts, policies | Strong centralized control | Harder across remote systems | Requires mature federated governance |
| Scalability | Supports BI, engineering, and ML together | Excellent for structured BI | Bounded by source systems | Scales organizationally with ownership |
| Migration Disruption | Supports source-by-source coexistence | Moderate | Low initially | High organizational change |
For a six-source dashboard estate, federation is useful as a transition mechanism, not as a permanent home for repeated production joins. OneLake no-copy shortcuts can expose data without another physical copy, but complex transformations and schema-control requirements still favor managed local tables.
We use warehouse-first ELT when the estate is primarily structured, SQL-first, and focused on mature dimensional BI. We use a lakehouse when those needs overlap with semi-structured data, engineering pipelines, and machine learning. Teams comparing a broader unified platform should preserve the serving layer that already works while consolidating reusable data underneath it.
How Do Bronze, Silver, and Gold Prevent Downstream Breakage?
Layers are not merely folders with precious-metal names. They are responsibility boundaries. When teams define the owner, contract, quality gate, and intended consumer for each layer, they can change pipelines without silently changing an executive KPI.
| Layer | Data Responsibility | Quality And Contract Gate | Primary Consumers | Accountable Owner |
|---|---|---|---|---|
| Bronze | Preserve source-aligned raw records | Capture arrival time, schema, source identifier, and failures | Engineering and audit teams | Ingestion owner |
| Silver | Create validated reusable entities | Test keys, completeness, conformance, and schema changes | Engineers, analysts, and ML teams | Domain data-product owner |
| Gold | Publish BI-ready facts, dimensions, and metrics | Certify definitions, freshness, access policy, and versioning | BI teams and business users | BI or data-product owner |
A shared catalog makes products discoverable, but lineage makes them safe to change. We use ownership, contracts, and deprecation windows so a Silver schema change cannot unexpectedly break a Gold metric. Purview lineage can trace data from raw staging through transformations into visualization assets, making root-cause analysis far faster when a number changes.
Access policies belong beside the data product, not inside every report. Role-based access, row restrictions, column restrictions, certified semantic models, and documented KPI definitions reduce report-level reinvention. Teams building these capabilities can deepen their lakehouse engineering practice before expanding the number of sources.
Which Serving Model Keeps BI Fast While BI and ML Share Data?
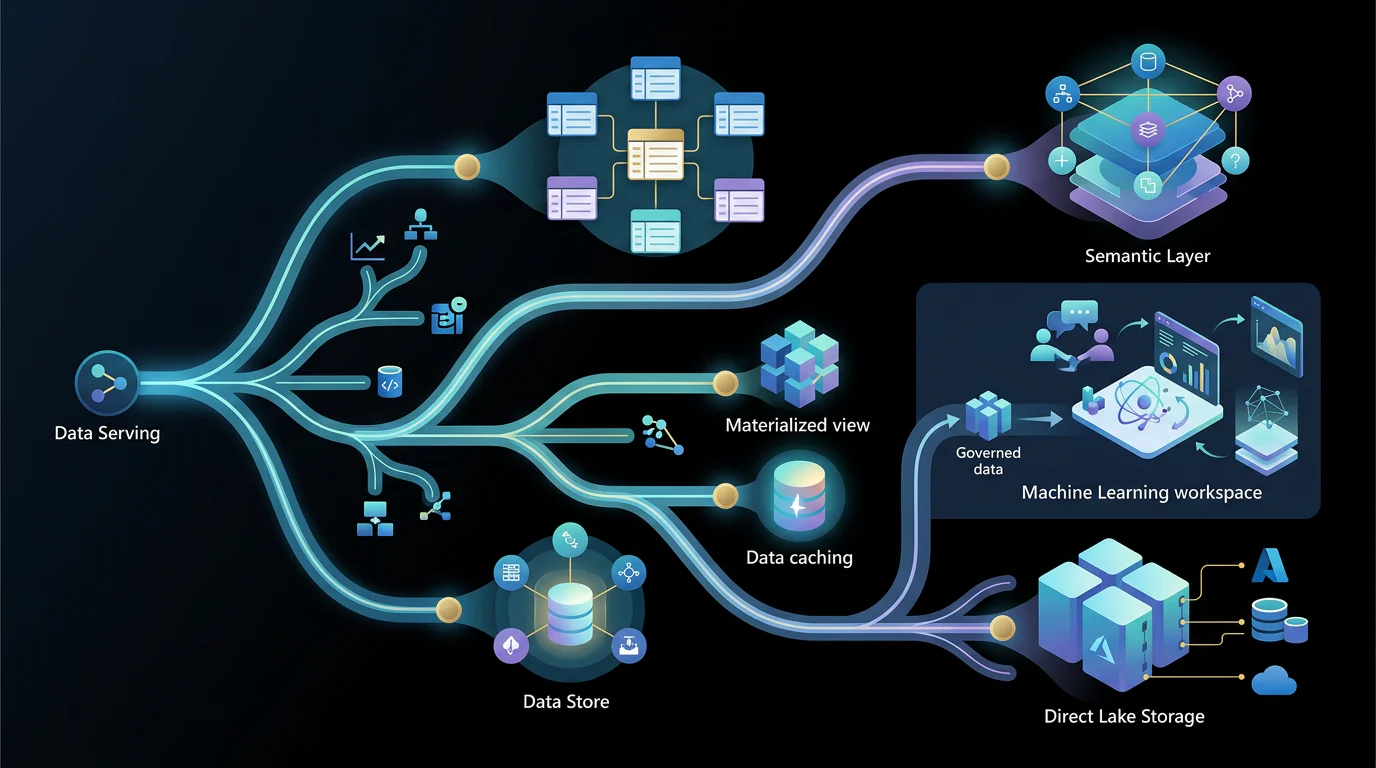
The same storage does not mean every workload should query the same table in the same way. We choose serving models by query shape, freshness expectations, semantic reuse, and concurrency. That preserves a shared source of truth while keeping interactive BI from inheriting every exploratory ML or engineering workload.
When Should We Use a Star Schema?
We use a star schema as the default for reusable cross-functional BI: facts for measurement, dimensions for filtering and grouping, and a semantic model for shared calculations. It gives reports a stable model instead of asking each author to reconstruct relationships from detailed source tables.
When Should We Use a One-Big-Table or Materialized View?
A one-big-table model can suit a narrow, stable dashboard with limited relationships and a well-defined audience. A materialized view fits expensive repeated joins or aggregates that should run during refresh, not visual rendering. The materialized view pattern is specifically intended to simplify complex queries and improve reporting performance.
When Should We Use Direct Lake or Caching?
We use Direct Lake for curated Delta tables and large interactive models where a full import copy is impractical. We use caching for frequently requested dashboard tiles and aggregation tables for common rollups. Microsoft describes Direct Lake as a Delta-backed model path that normally outperforms DirectQuery interaction.
When Is a Semantic Layer Mandatory?
A semantic layer is mandatory when multiple reports need the same KPI definitions, relationships, security behavior, or certified calculations. It is the release boundary between governed Gold data and dashboard authors. That boundary is especially valuable when teams are deciding between a shared real-time stack and a common analytical model.
How Can You Migrate Dashboards and Prove the Lakehouse Improved Them?
We migrate source by source and dashboard family by dashboard family. The objective is coexistence, not a risky switch-over: legacy dashboards remain available while new Gold products and semantic models prove their correctness against the same business questions.
Start by inventorying sources, dashboard dependencies, refresh schedules, source load, owners, and KPI logic. Land one low-risk source in Bronze, validate reconciliation, create one Silver entity and one Gold product, then run the new and legacy models in parallel. We only redirect users after KPI parity, security checks, freshness checks, and rollback ownership are clear.
| Metric | Current Baseline | After Each Migration | Comparison Method |
|---|---|---|---|
| Dashboard Visual Latency | Capture verified p50 and p95 render time | Capture the same measures after cutover | Same report, filters, capacity, and test window |
| Concurrency | Record concurrent viewers and queries | Repeat at the same load profile | Controlled concurrency test |
| Refresh Duration | Record end-to-end refresh duration | Record Gold and semantic-model refresh duration | Same source-change window and data volume |
| Compute Cost | Record capacity consumption for BI and ingestion | Record equivalent post-cutover consumption | Same billing period and workload scope |
Avoid declaring success because one visual loads faster in isolation. We validate dashboard p50 and p95 latency, concurrency, refresh duration, compute cost, source load, contract failures, and metric parity together. Teams can combine this work with Azure ETL options when not every transformation requires the same engine. That evidence distinguishes a durable lakehouse architecture for BI performance from a dashboard optimization that simply moves the bottleneck elsewhere.
Build the Architecture with Vision Board
At Vision Board, we help Azure data teams turn architecture choices into work they can defend in a design review and operate after launch. We focus on the practical handoffs that make a lakehouse useful: defining source contracts, building Bronze, Silver, and Gold responsibilities, choosing BI serving models, testing capacity behavior, and documenting a migration that keeps reporting live. Our learning paths connect engineering decisions to real implementation tasks, so teams can explain why a semantic model, materialized view, shortcut, or isolated workspace belongs in the design. Whether your team is untangling six-source dashboards or standardizing new products, we can help you establish repeatable patterns before complexity becomes permanent. We bring the same discipline to governance, lineage, ownership, and performance evidence, because a faster dashboard only lasts when people can trust the numbers and maintain the system. Start with Vision Board.
FAQs on Lakehouse Architecture for BI Performance
How Do I Centralize BI Data Without Slowing Dashboards?
Land each source once, standardize shared entities in Silver, then serve certified Gold models through a semantic layer instead of repeatedly joining operational systems directly.
Can BI and Machine Learning Share Lakehouse Data?
Yes. Engineering and machine learning teams can use governed detailed Delta tables, while BI uses curated Gold models and shared semantic definitions from that storage.
When Should I Use Direct Lake Instead of Other Serving Models?
Use Direct Lake for curated Delta tables and interactive analysis, materialized views for repeated costly transformations, and caching for frequently viewed dashboard tiles with consistent responses.
Which Metrics Prove a Lakehouse Improved BI Performance?
Track p50 and p95 visual latency, concurrent users, refresh duration, compute cost, KPI parity, freshness, and source load under matching dashboard and data conditions.