


TL;DR
We use a unified lakehouse architecture to let SQL analysts, Spark engineers, and machine learning practitioners share governed transactional data while retaining separate compute experiences. This guide maps the control plane and data plane, shows the end-to-end workflow, compares platform profiles, and gives teams a measurable proof-of-concept method before standardising.
One Unified Lakehouse Architecture for SQL, Spark, and ML
The choice of table design matters because the specification identifies three adopted versions, each built to manage large collections of files as tables instead of loose directories. That is the foundation a cross-functional team needs before it can make SQL, Spark, and machine learning agree on the same facts.
A unified lakehouse architecture lets analysts, engineers, and data scientists share governed transactional tables while using different SQL, Spark, and machine learning compute. Object storage and table formats make up the data plane. Identity, catalog, policy, lineage, orchestration, and workspace controls form the control plane that keeps dashboards, pipelines, and models consistent.
We map the architecture from raw input to BI, show who owns each control, and give teams a practical way to compare platform profiles before committing. We also focus on the operational details that decide whether a shared lakehouse remains trusted after its first schema change or failed pipeline.
How Does a Unified Lakehouse Architecture Work?
We separate the question into two layers. The data plane contains the actual files, transactional tables, feature data, and scored outputs. The control plane decides who can see them, who can change them, how they are discovered, and what evidence proves a dashboard or model used the right version.
| Layer | What It Contains | What It Must Prevent |
|---|---|---|
| Data Plane | Object storage, transactional tables, raw files, curated facts, features, predictions | Unmanaged copies and inconsistent table versions |
| Control Plane | Identity, catalog, permissions, lineage, policies, orchestration, workspaces, monitoring | Unauthorised access, hidden dependencies, and metric drift |
| Compute Plane | SQL endpoints, Spark jobs, notebooks, model training, batch scoring | One workload starving another or sharing unsafe settings |
| Semantic Plane | Certified metrics, relationships, dimensions, business definitions | Different dashboards calculating the same metric differently |
A transactional format makes this model workable because it records committed table state rather than asking every consumer to infer truth from a folder of files. The open table docs describe ACID transactions, schema enforcement, batch and streaming support, and version history as core capabilities. We use those properties to give every role one governed data contract, even when their compute engines differ.
We recommend a clear rule: teams may isolate compute, but they should not create a second operational source of truth merely to serve a different role. A SQL analyst can use a SQL endpoint, an engineer can use Spark, and a data scientist can train a model, while each reads the same approved tables through permissions enforced by the control plane.
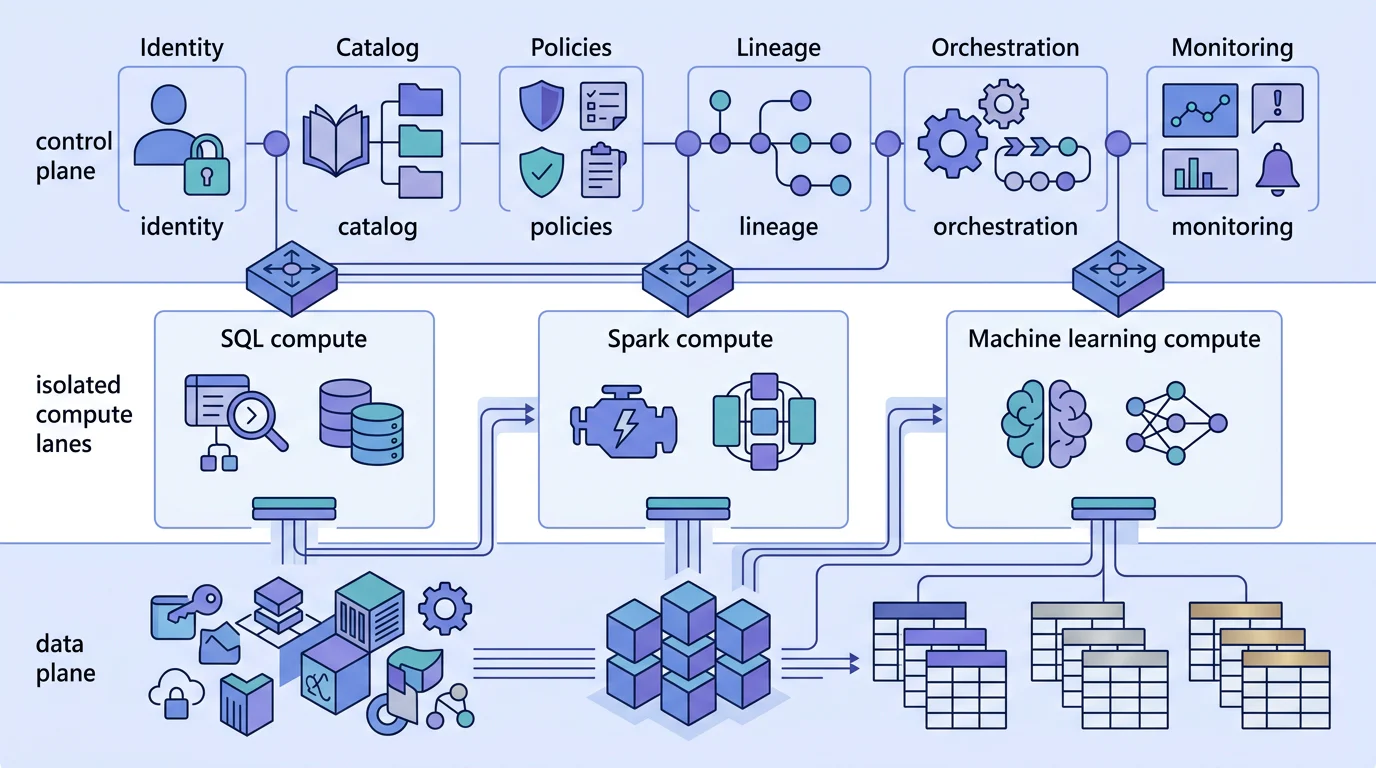
We use this unified analytics platform model to make a useful distinction between one physical copy and one logical source of truth. A temporary sandbox output can be acceptable. A dashboard, pipeline, or model that silently depends on it is not.
How Does Data Move from Raw Input to BI?
A shared lakehouse earns its value when the workflow is explicit. We start with raw data that can be replayed, promote it through tested transformations, create feature-ready tables, record model outputs, and serve approved SQL objects to the BI layer. Each handoff should create metadata and lineage, not a fresh unmanaged extract.
How Do We Ingest and Preserve Raw Data?
We land files, API responses, or change events in a raw zone with an ingestion timestamp, source identifier, schema record, and run ID. Engineers preserve this layer so they can replay a failed transformation or investigate a later discrepancy without asking a source system to recreate history.
Before promotion, we require an owner, classification, retention policy, and quality expectation. This makes the raw zone usable for recovery without making it an analyst-facing source.
How Do Engineers Create Shared Tables?
Spark transformations clean, join, validate, and promote data into curated tables. We keep table contracts near the code: expected columns, grain, freshness expectation, primary business key, and rules for late arriving data. That is how engineers can improve a pipeline without quietly changing the meaning of a downstream measure.
For an operational design, we pair curated tables with our governed lakehouse guidance. The point is not a particular orchestration interface. It is a reliable contract from source through promotion and recovery.
How Do Data Scientists Train and Score Models?
Data scientists read approved feature tables instead of maintaining personal extracts. Each experiment records the input table version, feature definition, code version, parameters, evaluation metrics, and model artifact. Once approved, the model writes batch predictions to a governed table with model version and score timestamp fields.
For XGBoost work, we treat the feature table as a product with owners and tests. That prevents a model from training on a column that later changes meaning, and it lets an analyst explain which model generated a prediction displayed in a report.
How Do Analysts Serve Consistent Metrics?
Analysts consume gold tables through SQL, then define relationships, metrics, filters, and row-level access once in a semantic layer. We certify the metric definition before it appears in a dashboard and version it when business logic changes.
That approach supports centralized analytics without making every team share a notebook or query editor. The shared surface is the governed table and semantic definition, not a forced common user experience.
How Do Roles and Controls Prevent Metric Drift?
A lakehouse fails when ownership is vague. We assign responsibilities by the decision each role can safely make, then create evidence that another role can inspect later. This turns governance from a review meeting into part of daily delivery.
- SQL Analysts: Own certified metric definitions, dashboard validation, and consumer feedback. They consume approved objects and request changes through a visible contract.
- Data Engineers: Own ingestion, Spark transformations, data quality checks, backfills, and recovery runbooks. They publish table versions rather than distributing extracts.
- Data Scientists: Own feature logic, experiment evidence, model evaluation, registration, and prediction outputs. They do not redefine enterprise metrics inside notebooks.
- Platform Engineers: Own identity integration, workspace boundaries, compute policy, deployment templates, monitoring, and chargeback tags.
- Governance Owners: Own classification, stewardship, access policy patterns, glossary approval, and audit evidence.
The most important shared artifact is a catalog entry that states what a table means, who owns it, which policy applies, and which consumers depend on it. We use our role map to make those boundaries visible before production work begins.
Lineage closes the loop. A trustworthy path should run from raw source to curated table, feature table, model output, SQL object, semantic definition, and dashboard measure. The provenance guidance notes that understanding a dataset’s provenance is essential across many disciplines.
Permissions should also follow the data rather than the tool. A restricted column stays restricted whether someone accesses it through SQL, Spark, or a BI connection. We avoid creating a privileged dashboard extract merely because a reporting tool needs a simpler connection path.
Which Platform Profile Fits a Cross-Functional Team?
We recommend comparing operating models, not marketing categories. The right choice depends on cloud commitment, Spark depth, model lifecycle requirements, BI connection path, table-format portability, and the team’s appetite for administration. A platform that looks unified in a demo can still create separate control planes for governance, deployment, or ML operations.
| Decision Area | Integrated Analytics Suite | Spark-First Lakehouse | Unified Multi-Service Studio | Warehouse-First Platform |
|---|---|---|---|---|
| Storage Model | Centrally managed data lake | Cloud object storage with governed tables | Multiple cloud storage and analytics services | Managed warehouse plus external storage options |
| Table Formats | Open transactional formats | Transactional lake tables | Service-specific lake and warehouse tables | Warehouse tables and open table support |
| SQL Experience | Native SQL serving | Dedicated SQL compute | SQL editor across connected services | Mature warehouse SQL |
| Spark Experience | Integrated Spark workload | Core engineering runtime | Connects to managed Spark services | Connector-based Spark access |
| ML Lifecycle | Notebook, experiment, registry path | Deep experiment, registry, and serving path | Managed ML service integration | Registry and in-warehouse inference path |
| Governance | Shared catalog and policy model | Central catalog, permissions, lineage | Cross-service catalog and access model | Warehouse governance and policy model |
| BI Connectivity | Strongest with its native BI layer | SQL connector route for external BI | Depends on selected query service | Broad SQL BI connectivity |
| Administration | Lower operational burden | More compute and workspace controls | Multi-service configuration overhead | Warehouse-first operational model |
For a team with heavy Spark transformation, XGBoost experiments, and an external BI contract, we test the Spark-first profile first. It keeps high-volume engineering and ML work closest to the native compute experience while retaining a governed SQL serving layer.
For a team whose primary output is a native BI estate and whose priority is a lower administration burden, we test the integrated suite first. This profile can reduce handoffs, but it still needs a serious POC for Spark concurrency, model release workflow, and external BI requirements.

A warehouse-first option can be attractive when SQL is dominant, while a multi-service studio can fit teams already committed to its surrounding cloud services. Neither should win by default when Spark engineering and model lifecycle are central. We use our platform comparison framework to turn these claims into testable evidence.
How Do We Test, Isolate, and Recover Workloads?
We isolate SQL dashboards, scheduled Spark jobs, interactive notebooks, and model training into separate compute policies or capacity budgets. Shared data does not require shared resource contention. This separation protects an executive dashboard from a large feature-engineering run, and it makes chargeback far easier to explain.
We also use separate development, test, and production boundaries. Code, table contracts, permission tests, and semantic definitions move together. A release is incomplete if a new table arrives without its owner, lineage, policy, and dashboard regression check.
| Proof Point | Weight | Evidence We Require |
|---|---|---|
| Spark Pipeline And Recovery | 20% | Representative jobs, forced failure, and successful idempotent replay |
| XGBoost Lifecycle | 15% | Train, track, register, batch-score, and roll back one model |
| SQL And BI Performance | 15% | Measured p95 query latency, refresh duration, and metric validation |
| Concurrent Workload Isolation | 15% | Queue time, concurrency results, and no cross-workload failure |
| Governance And Lineage | 15% | Full source-to-dashboard and source-to-prediction evidence |
| Delivery And Administration | 10% | Deployment effort, test records, and operating ownership |
| Cost And Chargeback | 10% | Metered compute, storage, network, BI, and idle resource cost |
We reject any option that fails the governance or recovery gate, regardless of its benchmark score. A lower cost estimate is not useful if the team cannot identify who changed a metric, restore the last good data version, or rerun a failed pipeline safely.
We retain structured operating logs because NIST guidance defines log management as generating, transmitting, storing, accessing, and disposing of event data. For day-to-day operations, we monitor freshness, p95 dashboard latency, Spark queue time, failed runs, training duration, model drift, policy denials, and metered cost.
Our Azure lakehouse guide helps teams translate those measures into a practical learning and operating sequence.
Learn with Vision Board
At Vision Board, we teach teams to make these choices by building the architecture, not memorising product menus. Our Azure data engineering learning starts with a shared lakehouse: data contracts, transactional tables, Spark transformations, SQL serving, semantic definitions, and controlled releases. We then run the difficult parts that create production confidence, including permission tests, failure recovery, workload isolation, cost attribution, and model handoffs. That approach helps engineers explain why a dashboard number is trusted, where a feature came from, and who can safely change it. For a team moving from scattered tools to a governed operating model, we can shape a practical lab sequence around your source systems, BI expectations, and deployment workflow. We keep the focus on evidence your team can reproduce after training, not a polished demo that disappears when the first incident arrives. Explore our complete Vision Board.
FAQs on Unified Lakehouse Architecture
Can SQL, Spark, and Machine Learning Teams Really Share One Lakehouse?
Yes. Governed tables create one data contract, while separate SQL, Spark, and machine learning compute pools protect each role from competing workloads, failures, and tuning decisions.
What Is the Difference Between the Data Plane and Control Plane?
The data plane holds transactional tables and files. The control plane applies identity, catalog metadata, permissions, lineage, orchestration, workspace rules, and operational evidence for teams.
Which Platform Profile Fits Spark, XGBoost, and External BI Best?
For this workload, test the Spark-first profile first. Test the integrated analytics profile only when the existing BI stack and lower administration burden carry greater weight.
How Do Semantic Definitions Prevent Dashboard Metric Drift?
A semantic definition records metric grain, filters, joins, and calculations once. Teams certify it, version changes, and point dashboards toward it instead of rebuilding business logic.
What Should a Lakehouse Proof of Concept Measure?
Measure p95 dashboard latency, concurrent queueing, recovery completion, lineage coverage, deployment effort, and metered cost. Reject any option that fails governance or recovery requirements during testing.