


TL;DR
We recommend a warehouse for structured, high-concurrency BI that needs straightforward SQL serving, and a lakehouse when shared engineering, mixed data, or machine learning also matter. This guide shows Azure teams how to remove dashboard-time joins, build one governed query path, choose a hybrid serving layer, and validate latency, concurrency, freshness, and cost with measured workloads.
Lakehouse or Warehouse for Fast BI?
For Azure BI teams, the pressure point is rarely storage alone. Power BI recommends a five-second target for requested visual data, which makes dashboard-time joins across operational systems a poor default.
For a lakehouse or warehouse for fast BI decision, we recommend a warehouse as the default serving layer when dashboards are mostly structured SQL and the team needs predictable operations. A lakehouse is stronger when the same data must support engineering, mixed formats, or machine learning. For many Azure teams, the practical answer is a hybrid.
We will show how to centralize six or more sources without preserving cross-source joins in reports, then choose and test the serving path that meets real latency and concurrency requirements.
How Should You Choose a Lakehouse or Warehouse for Fast BI?
The right choice starts with the dashboard workload, not with a platform label. If most consumers need governed metrics from structured data, a warehouse-oriented serving layer gives us the shortest path to dimensional models, SQL access, and controlled operations. If data engineering, mixed formats, and machine learning need the same data, a lakehouse gives us a broader foundation.
| Decision Criterion | Warehouse Serving Layer | Lakehouse Serving Layer | Hybrid Pattern |
|---|---|---|---|
| Interactive Latency | Strong default for structured SQL serving | Depends on table layout and semantic model design | Uses the best serving path per workload |
| Dashboard Concurrency | Simpler to isolate and manage | Requires capacity and query-path testing | Keeps engineering work away from dashboard demand |
| Structured Data | Excellent fit | Excellent fit | Excellent fit |
| Semi-Structured Data | Usually needs preparation first | Natural fit for shared raw and curated data | Lakehouse handles preparation |
| ML Access | Often requires a separate data path | Supports shared engineering and ML access | Keeps ML near curated data |
| Semantic Model Fit | Strong for dimensional marts | Strong with Direct Lake or SQL access | Strongest option for mixed use cases |
| Governance | Central SQL and semantic controls | Requires consistent controls across layers | Clear ownership at each layer |
| Maintenance | Lower serving-layer effort | More attention to table health | Focuses optimization where it matters |
| Portability | Depends on the serving technology | Shared open data formats can help | Balances reuse and specialized serving |
| Cost Measurement | Measure SQL and capacity consumption | Measure engineering and read consumption | Measure both paths against the same workload |
Microsoft documents both all-lakehouse medallion layers and a pattern with lakehouse bronze and silver layers plus a warehouse gold layer in its medallion patterns. That is the useful distinction: one architecture can be sufficient, but a hybrid is justified when the BI serving workload and engineering workload have different needs.
We should also size against the actual capacity guardrails. For example, documented F64 limits include 25 GB maximum semantic-model memory, 50 concurrent DirectQuery connections per model, and 4 to 8 DirectQuery parallelism, while larger SKUs change those limits. Treat those F64 limits as planning inputs, not proof that a report will be fast. For source movement design, our pipeline guide connects orchestration choices to the downstream analytical model.
Why Do Dashboard-Time Joins Fail?
A report that joins CRM, finance, product, support, web, and operational data at click time does not create one reliable analytical model. It creates several query paths, several definitions of the same business entity, and several places for source changes to break a visual. The more reports reproduce those joins, the harder it becomes to explain why two dashboards disagree.
DirectQuery makes that fragility visible because each user action can send queries back to the underlying source. Complex transformations, calculated join columns, bidirectional filters, and multi-select slicers can all add cost or complexity, which is why Microsoft’s DirectQuery model guidance recommends materializing transformations upstream where possible.
Instead, we centralize source data, standardize business definitions, and publish facts and dimensions once. Our centralization plan is useful here because it frames consolidation as a sequence of repeatable data products, not a request for every dashboard author to become an integration engineer.
The design principle is simple: dashboards should ask a semantic model for revenue, margin, inventory, or retention. They should not decide how to reconcile six operational systems while a user waits.
What Centralized Azure Architecture Replaces Cross-Source Joins?
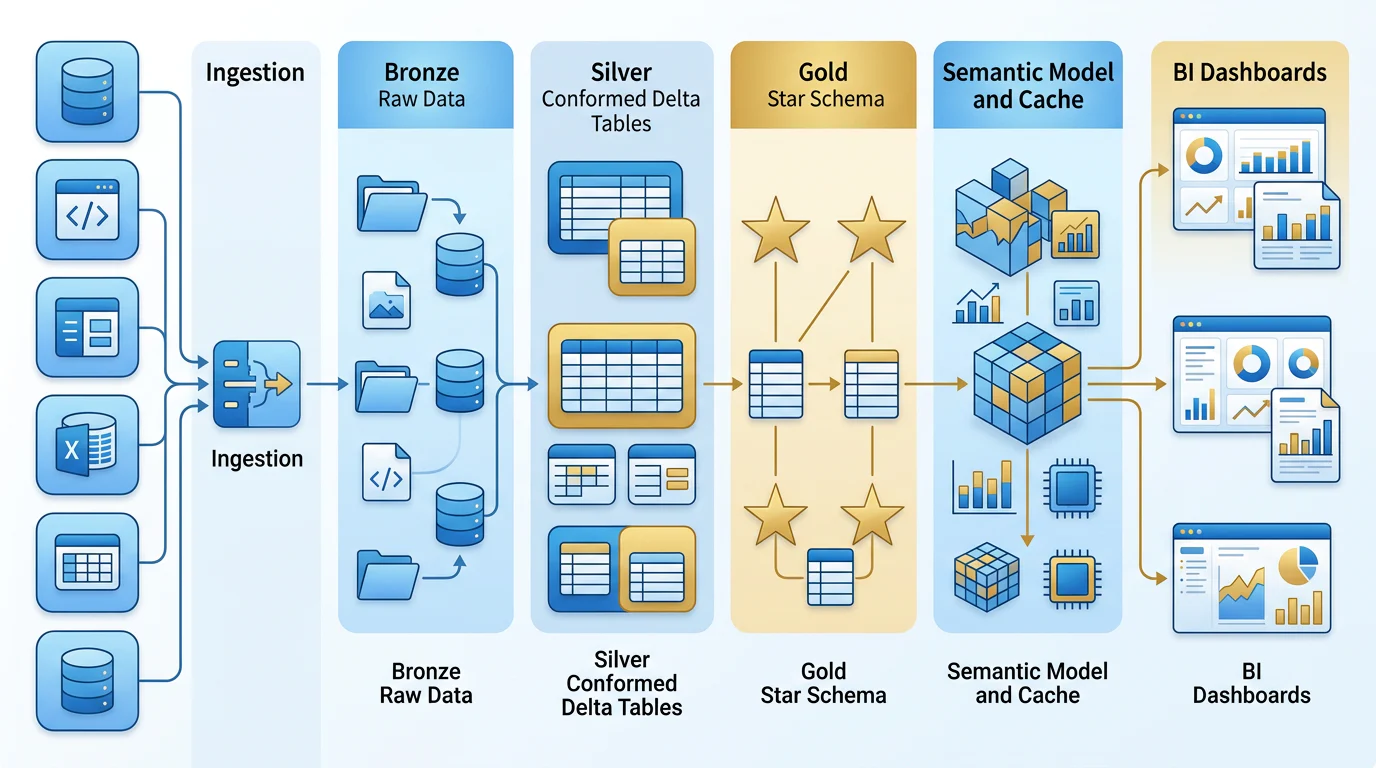
A centralized BI architecture separates ingestion, conformance, serving, and consumption. That separation lets us improve data quality without asking analysts to give up freshness, and it keeps repeated BI queries away from production applications.
Ingest Sources into a Raw Layer
Ingestion is responsible for copying, mirroring, or referencing source data with lineage and refresh controls. Fabric documents pipelines for large-scale movement, notebooks for complex transformations, and eventstream for real-time ingestion in its ingestion guidance. We use that layer to preserve source history, not to make it report-ready.
Conform Data Before It Reaches Reports
Silver tables standardize identifiers, timestamps, currencies, status codes, and historical rules. This is where customer records from different systems become one conformed customer dimension and where each operational transaction becomes a governed fact candidate.
At the gold layer, we build star schemas with facts at a declared grain and reusable dimensions for date, customer, product, geography, and organization. Microsoft’s star schema guidance links this structure directly to Power BI performance and usability. Our governance approach extends that work into ownership, lineage, and shared definitions.
Serve One Semantic Model
The semantic model becomes the contract between data engineering and report authors. It owns relationships, measures, row-level security, business labels, and aggregate behavior. Reports connect to that model, not directly to raw lakehouse tables or operational applications.
A healthy query path is: report visual, semantic model, cache or aggregation when available, Direct Lake or SQL serving query on a miss, then curated gold tables. Microsoft describes semantic models as the business-friendly analytical layer and commonly models them as facts plus dimensions in its semantic model guidance.
Can a Lakehouse Deliver Sub-Second BI Queries at Petabyte Scale?
Yes, a lakehouse can support very fast BI interactions, but architecture alone does not guarantee sub-second results. At petabyte scale, query performance depends on the complete path: file layout, partition choices, table maintenance, semantic model design, cached aggregates, capacity, and concurrent report activity.
Direct Lake can be a strong fit because it reads Delta tables into the Power BI engine without the usual import duplication. It can also fall back to DirectQuery when capacity, memory, or unsupported features require it, so we should monitor real behavior rather than assume every visual uses the fast path. Microsoft explains those fallbacks in its Direct Lake guidance.

Model for Repeated Questions
The fastest dashboard query is often the one that never touches the largest detail table. We use aggregate tables for frequent executive questions, Dual dimensions when appropriate, and carefully scoped drill-through for detail. Microsoft suggests an aggregation table should generally have at least a 10 times smaller row count than its underlying detail table in its aggregation guidance.
Tune Data Layout for the Read Pattern
Partitioning helps only when report predicates use the partition column. We also keep files compact, update source-engine statistics where applicable, and use materialized views for repeated relational work. Fabric warehouse guidance recommends source files between 100 MB and 1 GB for efficient throughput and warns that frequent small writes can increase latency through fragmentation. See the warehouse performance guidance.
| Performance Lever | What It Protects | What We Measure |
|---|---|---|
| Star Schema | Join simplicity and measure consistency | Visual p95 latency |
| Conformed Dimensions | Reusable filters across reports | Metric reconciliation defects |
| Aggregate Tables | High-frequency summary queries | Aggregate hit rate |
| Materialized Views | Repeated relational transformations | Query duration before and after |
| Partitioning | Selective scans | Data scanned per query |
| Statistics | Better query plans | Plan regressions |
| Compaction | Small-file overhead | File counts and planning time |
| Caching | Repeated visual requests | Cache hit rate |
Treat Read Optimization as a Tradeoff
Read-heavy tables deserve read-heavy optimization. Fabric documents that V-Order can add about 15% to write times on average while improving compression by up to 50%, but the result still varies by workload. That is why we test the V-Order documentation against real report queries before standardizing it.
For a broader learning path on the shared SQL, Spark, and ML foundation behind this choice, see our architecture primer.
When Is a Hybrid Serving Layer the Better Choice?
A hybrid pattern becomes sensible when the data platform has two legitimate jobs. Engineers need detailed, flexible, reusable data for transformations and machine learning, while business users need predictable dashboard behavior from a curated model. Trying to make one report-facing query path satisfy every engineering use case usually produces more complexity than value.
A warehouse-only pattern can be enough when sources and transformations are overwhelmingly structured and SQL-centric. A lakehouse-first pattern can be enough when teams can keep curated Delta tables healthy and dashboard access runs through a well-designed semantic model. A hybrid earns its extra design effort when it isolates high-concurrency BI from heavy engineering jobs without recreating dashboard-time joins. Our performance guide explains the design choices that protect the BI path.
Use Six Inputs to Make the Decision
We make the decision from six verified inputs, not from a single data-volume threshold.
- Freshness requirement: Record the maximum acceptable source-to-dashboard delay.
- Latency requirement: Set p50 and p95 visual targets for common and drill-through views.
- Peak concurrency: Count concurrent viewers, visuals per page, and scheduled refresh demand.
- Data type: Identify structured, semi-structured, unstructured, and streaming inputs.
- Workload mix: Separate BI, engineering, ad hoc SQL, and machine learning demand.
- Team capacity: Confirm who owns dimensional modeling, table health, capacity, and incident response.
Benchmark the Query Path Before Committing
A benchmark should use a representative semantic model, realistic security rules, current refresh frequency, and the same peak dashboard shape users will actually see. We run isolated baseline tests first, then concurrent report tests, then repeat the test immediately after refresh or ingestion. Capacity telemetry matters because overload can delay or reject operations, as the Fabric capacity metrics guidance explains. Our analytics centralization framework can help teams turn those measurements into a phased architecture instead of a disruptive rebuild.
| Benchmark Field | Record |
|---|---|
| Dataset Size | Actual curated data size and daily change volume |
| Source Complexity | Number of sources and joins removed before reporting |
| Visual Latency | Measured p50 and p95 for priority visuals |
| Concurrency | Peak simultaneous users, visuals, and query rate |
| Freshness | Observed source-to-dashboard delay |
| Refresh | Measured refresh duration and overlap with report use |
| Cache Behavior | Aggregate, cache, Direct Lake, and DirectQuery behavior |
| Capacity | Compute consumption, throttling events, and failure count |
| Cost | Measured cost for the reporting period |
The final choice should be the lowest-operational-effort pattern that meets verified p95 latency, concurrency, freshness, governance, and cost requirements. “Sub-second” is a workload result, not an architectural promise.
Build Better BI Decisions with Vision Board
At Vision Board, we help Azure data engineers turn architecture decisions into designs they can defend in reviews, build in production, and explain to stakeholders. Our learning paths connect ingestion, Delta modeling, SQL serving, semantic models, Power BI performance, governance, and measurement, so your team can see how each layer changes the dashboard experience. We use realistic exercises to make you trace a visual back through its model, cache, SQL endpoint, and curated tables, then decide which bottleneck matters. That perspective is useful whether your organization is modernizing reports, consolidating several operational systems, or preparing for an Azure data engineering role. We also show how to articulate assumptions before teams spend capacity or rewrite pipelines. Start with the learning route that matches your current gap, practice the tradeoffs with a working project, and carry a repeatable benchmark method into your next design discussion. Explore Vision Board
FAQs on Lakehouse or Warehouse for Fast BI
Should BI Dashboards Use a Lakehouse or Warehouse?
Choose a warehouse for structured SQL dashboards needing predictable governance. Choose a lakehouse for shared engineering and machine learning. Use hybrid when both workloads require equal attention.
Can a Lakehouse Deliver Sub-Second BI Queries?
Yes, after testing the full query path. Delta table layout, semantic-model design, aggregates, cache behavior, capacity, and concurrency determine whether common dashboard visuals meet latency targets.
What Architecture Reduces Joins Across BI Data Sources?
Centralize source data into a governed raw layer, conform it before reporting, publish shared facts and dimensions, then query one certified semantic model instead of live cross-source joins.
When Should a Lakehouse Use a Warehouse Serving Layer?
Choose hybrid when engineers need shared data for transformations or machine learning and business users need governed, high-concurrency dashboards. A warehouse or SQL endpoint serves the BI model.
How Should Teams Benchmark Their BI Architecture?
Measure p50 and p95 visual latency, peak concurrency, freshness lag, refresh duration, cache behavior, capacity consumption, and cost. Without representative measurements, architecture claims remain untested hypotheses.